
How do you measure EDR effectiveness for co‑managed IT in regulated NJ & NY companies?
Measure EDR effectiveness by tracking a small set of operational and service metrics, aligning those metrics to SLAs, and producing audit-ready reports that meet NYDFS and HIPAA expectations. Start with MTTD and MTTR, detection coverage, and false positive rate, then map those to documented incident timelines required by regulation.
MTTD (mean time to detect) is the average elapsed time from initial compromise to detection. MTTR (mean time to remediate) is the elapsed time from detection to containment and recovery. Regulators such as NYDFS under 23 NYCRR 500 require documented incident timelines and evidence of timely response; HIPAA audit guidance expects demonstrable detection and remediation records. Use local phrasing like "EDR SLAs NYC financial firm" when drafting SLAs to make obligations explicit for regional compliance reviews. For any inquiries or assistance, feel free to contact us.
Documented timelines convert an alert stream into a defensible audit record for NYDFS and HIPAA auditors.

Why measurement matters — business and compliance drivers
Measurement turns EDR from a tool into a business control. For regulated companies in New Jersey and New York, clear KPIs and SLAs prove you operate a repeatable security program: auditors want timelines, insurers ask for metrics before underwriting, and executives need risk signals to budget. For example, a NYC financial firm facing a regulator review must show the detection date, analyst triage timestamp, containment action, and remediation completion — not just a checkbox that EDR is installed. Understanding the nuances of EDR and threat hunting is essential for maintaining compliance and demonstrating effective security practices.
On the business side, KPIs inform where to invest: are missed detections a configuration problem or a staffing gap? On the compliance side, references like NYDFS 23 NYCRR 500 expect written incident response programs and timely reporting; HIPAA audits expect logged detection/remediation evidence. You should structure measurement so a three‑column view exists: operational (alerts), service (SLA performance), and compliance (audit artifacts).
Core EDR KPIs (MTTD, MTTR, detection coverage, false positive rate)
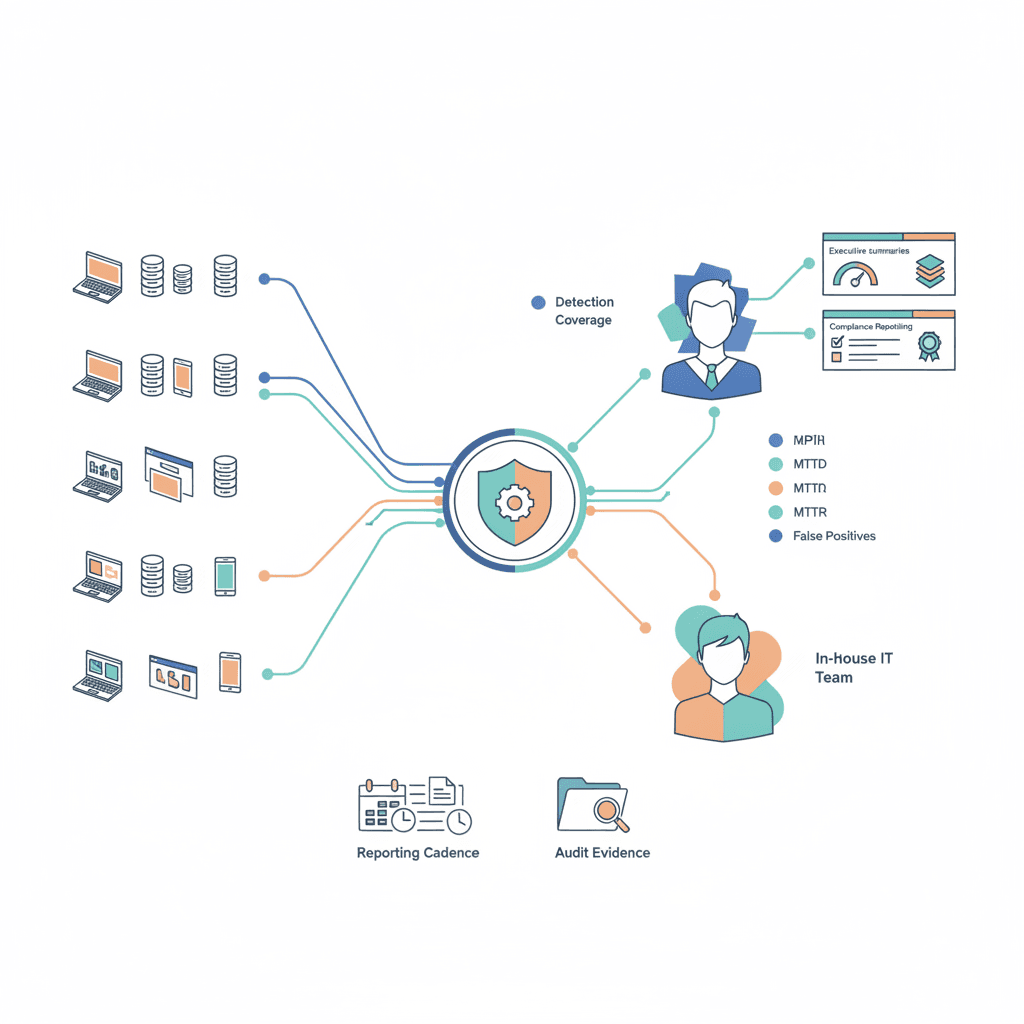
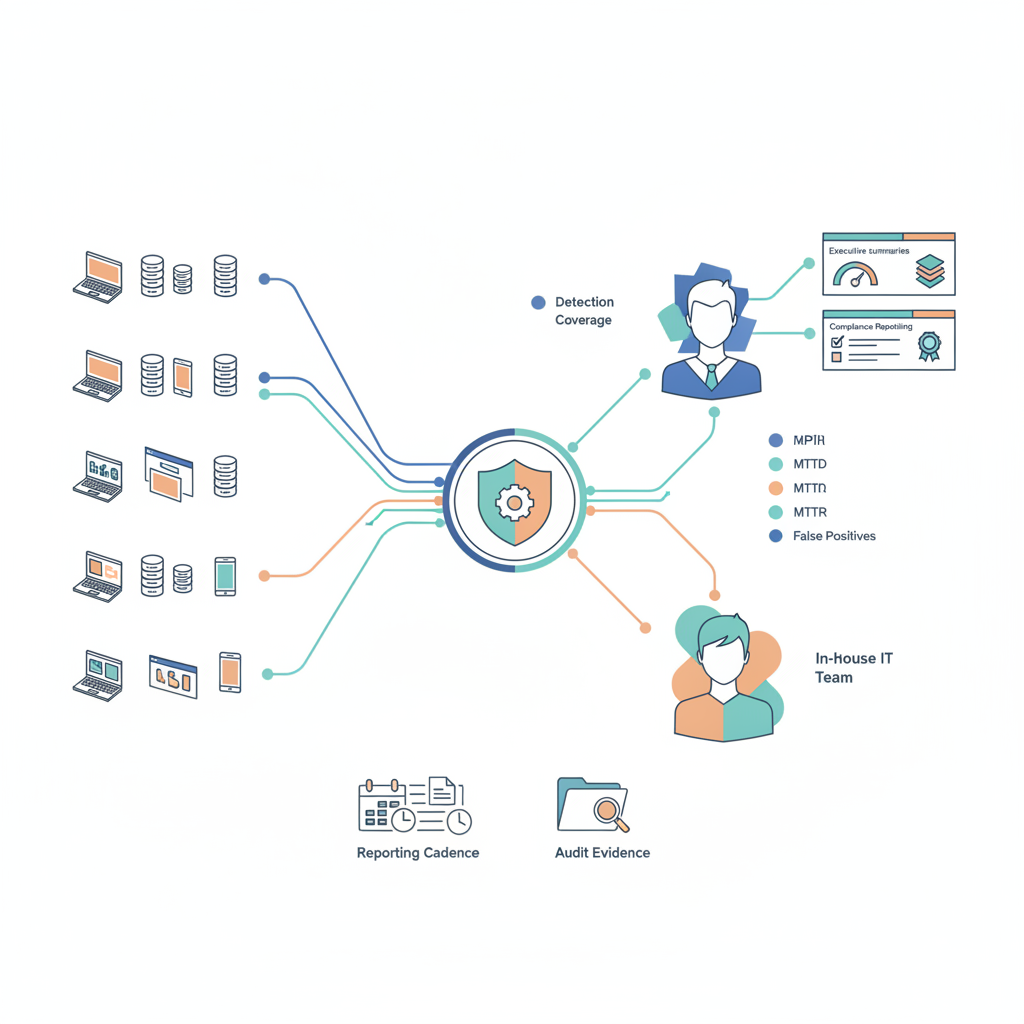
These four KPIs are the minimum set you must track constantly. MTTD and MTTR provide timeline evidence (quotable: "MTTD = average detection lag; MTTR = average remediation lag"). Detection coverage measures what percentage of endpoints and attack vectors are observed by EDR sensors. False positive rate tracks analyst time wasted and tuning needs. Example concrete thresholds for a mid-size regulated company: target MTTD under 8 hours for high‑severity alerts and MTTR under 24 hours for contained incidents — treat these as starting points, not guarantees.
Operationalize each KPI with data sources: MTTD from EDR detection timestamps; MTTR from ticketing and remediation logs; detection coverage from sensor deployment reports; false positive rate from analyst disposition fields. For edr metrics for msps, provide weekly exports to customers showing these fields and include a P95 MTTD calculation for executive summaries. For more on this, see Deploy edr hybrid co-managed nj ny.
Measure detection coverage as a percentage of managed endpoints with active sensors; that single number drives most prioritization.
Service-level metrics for co‑managed arrangements (responsiveness, escalation times)
Co‑managed EDR requires clarity about who does what and when. Define responsiveness (time to acknowledge an alert), initial triage time, and escalation time to senior engineers. For example: the MSP acknowledges critical alerts within 15 minutes, performs triage within 2 hours, and escalates unresolved incidents to the customer or MSSP tier within 4 hours. Label these commitments explicitly in the SOW as "EDR SLAs co‑managed IT" clauses so everyone knows the handoff points.
Include measurable artifacts: alert acknowledgement logs, triage notes with timestamps, and escalation tickets. For edr slas co‑managed it arrangements, include a runbook that maps each severity to a specific timeline and owner. When negotiating SLAs, add a clause requiring monthly SLA reports that show breaches, root causes, and corrective actions — this supports both operational improvement and compliance reporting.
Designing dashboards for technical, executive, and compliance audiences
A single dashboard won't serve every audience. Build three views: technical (real‑time alerts, analyst queue, triage notes), executive (trend lines for MTTD/MTTR, number of incidents by severity, business impact), and compliance (incident timelines, evidence links, policy exceptions). Each view should be filterable by time window and region; include local tags like "NY office" or "NJ‑regulated processing" to speed audits.
Design principles: surface one headline KPI per audience (executive: monthly MTTR; compliance: incidents with evidence links), include drilldowns to raw artifacts, and export to PDF for meeting packs. For edr reporting for compliance, ensure exported reports include immutable timestamps and links to the source logs so auditors can validate timelines without needing direct console access.
Example dashboard fields and templates
Below are concrete dashboard fields you can copy. Use a table for the main view so stakeholders know what to expect.
| Field | Description | Audience |
|---|---|---|
| MTTD (P95) | 95th percentile time from event to detection | Executive/Technical |
| MTTR (median) | Median time from detection to remediation | Executive/Technical |
| Detection coverage | % of endpoints with active sensor reporting | Compliance/Technical |
| False positive rate | % of closed alerts marked non‑threat | Technical |
| Open incidents by severity | Live queue with SLA countdown | Technical/Executive |
| Audit evidence pack | Linked artifacts for each closed incident | Compliance |
Reporting cadence and evidence collection for audits (NYDFS, HIPAA, insurers)
Set a reporting cadence that satisfies operations and regulators: daily operational exports for SOC analysts, weekly SLA summaries for IT leadership, and monthly audit packs for compliance and insurers. For NYDFS 23 NYCRR 500 and HIPAA, collect evidence that includes detection and remediation timestamps, analyst notes, scope of impact, and final root cause analysis. Store evidence in an immutable location or export with cryptographic hashes to show tamper resistance.
Concrete cadence example: daily CSV of new detections; weekly PDF SLA report showing MTTD/MTTR trends; monthly audit bundle containing incident timelines and logs. For edr reporting for compliance, build a checklist that maps each regulator requirement to a supporting artifact so you can produce a tailored packet on demand.
How KPIs should change during incident response vs steady state
In steady state, KPIs measure trends and capacity. During an incident, KPIs become operational controls: prioritize time‑to‑contain over monthly averages. Switch dashboard modes: show live response timers, owner assignments, and containment status. After containment, convert incident logs into KPI inputs for after‑action reviews to prevent repeat events.
Operational rule: freeze monthly averages during large incidents and create an incident‑specific timeline. This prevents a single big event from masking everyday performance in executive reports. For threat hunting kpis nj ny teams, track hunt ROI separately: hours spent vs detections validated to avoid conflating proactive work with reactive triage.
Using KPIs to optimize threat hunting investments (prioritization model)
Treat threat hunting like a portfolio: prioritize hunts that reduce high‑severity MTTD or improve detection coverage in critical asset groups. Build a simple prioritization matrix: impact on MTTD (high/medium/low) vs cost in analyst hours. Hunt targets that score high impact and moderate cost first.
Example decision rule: if a proposed hunt is expected to reduce P95 MTTD by more than one hour for critical assets and requires under 20 analyst hours, greenlight it. For threat hunting kpis nj ny operations, tag hunt results so you can show regional compliance teams which hunts produced detectable telemetry improvements over a quarter.
Prioritize threat hunts that measurably reduce MTTD for assets that would materially affect business continuity.
Contract language & SLA examples for MSP / MSSP engagements
Contracts must list measurable commitments: acknowledgement time, triage time, escalation time, reporting cadence, and data access for audits. Sample clause structure: define severity levels, map each to concrete timelines (acknowledge, triage, escalate), and include reporting deliverables with formats. Be explicit about ownership in co‑managed settings: who isolates endpoints, who applies remediation, who notifies regulators.
Use a checklist when drafting contracts: 1) define severity matrix, 2) assign owners per severity, 3) specify measurable timelines, 4) require monthly SLA reports, 5) require audit evidence exports upon request. Include an SLA credits clause for repeated breaches and a clause that obligates joint incident communications for regulated disclosures.
Common measurement pitfalls and how to avoid misleading metrics
Common mistakes: using raw alert counts as a success metric, ignoring detection coverage, and averaging MTTD across severities. Avoid these by normalizing metrics (use P95 for MTTD), reporting coverage as a denominator, and separating proactive hunting outputs from reactive incident metrics. Also avoid changing KPI definitions mid‑reporting period; if you must change them, document and rebaseline.
Practical fix: publish a KPI definitions document that explains data sources, calculation method, and any filters applied. For edr metrics for msps, include a change log in every monthly report so customers and auditors can trace metric definition changes.
Case study template: before/after EDR deployment metrics (anonymized)
Use a two‑column table to summarize anonymized before/after outcomes. Include baseline values, actions taken, and post‑deployment metrics to show impact without exposing client identities. This template helps SEC, insurers, or board reviewers quickly verify program improvements.
| Metric | Before | After | Notes |
|---|---|---|---|
| P95 MTTD | — | — | Replace with anonymized numbers |
| P50 MTTR | — | — | Show time windows and key remediation steps |
| Detection coverage | — | — | Percentage of endpoints reporting |
Recommended tooling and automation for continuous measurement
Combine EDR reporting, ticketing, and a BI tool for automated KPI pipelines. Connect EDR detection timestamps to your ticketing system so MTTR is computed automatically. Use scheduled exports for compliance bundles and an immutable storage location for audit packs. For example platforms: many teams pipe Microsoft Defender detection exports into a BI tool for trend dashboards (see vendor docs for supported report formats).
Automate SLA breach alerts so incidents that exceed escalation windows create tickets and emails. For edr slas co‑managed it agreements, automate the creation of a compliance bundle on incident closure that includes detection logs, triage notes, and remediation evidence.
Conclusion — action plan and offer for KPI baseline assessment
Action plan: 1) establish definitions (MTTD, MTTR, coverage, false positives), 2) instrument data sources, 3) build three dashboards, 4) draft co‑managed SLAs with measurable timelines, 5) schedule regular audit bundles. A baseline assessment will map your current state to this plan and produce a 90‑day roadmap.
Learn how these steps apply to your environment by reviewing our services or scheduling a conversation via contact us. You can also view a product demo at our services to see sample dashboards and reporting templates.
References
- FY 2025 CIO FISMA Metrics (CISA)
- Microsoft Defender for Endpoint — threat protection reports (Microsoft)
- Building a Threat‑Led Cybersecurity Program (ISACA)
FAQ
- What is measuring edr effectiveness? Measuring EDR effectiveness is the ongoing tracking of operational and service KPIs (MTTD, MTTR, detection coverage, false positive rate) and producing audit‑grade reports that demonstrate detection and remediation timelines.
- How does measuring edr effectiveness work? It works by instrumenting EDR and ticketing data, calculating defined KPIs, presenting them on role‑based dashboards, and exporting evidence bundles for audits and SLA verification.